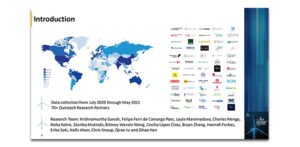
Tania Ziegler (CCAF), Rotem Shneor (UoA), Karsten Wenzlaff (CCAF), Krishnamurthy Suresh (CCAF), Felipe Ferri de Camargo Paes (CCAF), Leyla Mammadova (CCAF), Charles Wanga (CCAF), Neha Kekre (CCAF), Stanley Mutinda (CCAF), Britney Wanxin Wang (CCAF), Cecilia López Closs (CCAF), Bryan Zhang (CCAF), Hannah Forbes (CCAF), Erika Soki (CCAF), Nafis Alam (APU) and Chris Knaup (CCAF).
The 2nd Global Alternative Finance Market Benchmarking Report contributes 2019 and 2020 data, collected from financial technology firms that undertake digital lending and digital capital raising activities, to our globally comparable panel database on alternative finance. The study was supported by the UK Foreign, Commonwealth and Development Office, Invesco, The Inter-American Development Bank (IDB) and the Asian Development Bank Institute.
Global findings from the study
Asia Pacific regional findings from the study
Highlights from the report
China dominated the global online alternative finance market up until 2018. However, local market developments and regulatory changes have led to a considerable decline in volumes and its global market share. In 2019, the Chinese market accounted for 48% of the global volume, and in 2020 for only 1%. Accordingly, when Chinese volumes are included in our global analysis, total global market volume has notably decreased, falling 42% in 2019 and a further 35% in 2020 – from $304.5 billion in 2018 to $176 billion in 2019 and $114 billion in 2020.
When we exclude the Chinese market from our analysis, it emerges that global online alternative finance market has grown consistently over the past three years. Global volumes (excluding China) rose by 3% from $89 billion in 2018 to $91 billion in 2019. And in 2020, despite COVID-19, the global market volume rose a further 24% year-on-year to reach $113 billion.
The largest business model globally in 2019, when excluding China, P2P/Marketplace Consumer Lending remained the largest model type, with a total volume of $33.6 billion, accounting for 37% of the total global volume in 2019. In 2020, though still the largest single model, growth slowed down substantially, accounting for a total volume of $34.7 billion, or 31% of global market share.
Accordingly, in 2020, the largest regional alternative market was the United States and Canada ($73.93 billion) with the US being the largest national market with $73.62 billion, which accounted for 65% of global online alternative finance market volume. This is followed by the UK ($12.64 billion), Europe excluding the UK ($10.12 billion), the Asia Pacific excluding China ($8.90 billion), LAC ($5.27 billion), SSA ($1.22 billion), China ($1.16 billion) and MENA ($0.59 billion).
With on-balance sheet activities on the rise, and their relative dominance in the United States and Canada, it is not surprising to see that Balance Sheet Business Lending (excluding China) reported the second highest transaction volumes for both years among all models, with $19 billion in 2019 and $28 billion in 2020. Interestingly, the research has noted that 16% of firms who previously operated only a P2P/Marketplace model now engaged in on-balance sheet activities.
The donation-based crowdfunding model has experienced exponential growth, accounting for $7 billion globally in 2020. The leap in annual growth of 160% between 2019 and 2020, can be attributed largely to the flurry of COVID-19 related charitable, community and health-related online fundraising activities around the world.
Market concentration globally as measured by the Herfindahl-Hirschman Index (HHI), for the aggregate alternative finance market remains relatively low. However, when measuring the HHI for specific alternative finance business models, the analysis suggested that seven out of 10 online alternative models have experienced increased market concentration in 2020 compared to 2019. P2P/marketplace business lending, balance sheet business lending, and P2P/marketplace consumer lending showed the greatest increases in market concentration.
In 2020, that volume of online alternative finance (excluding China) that went to micro, small and medium-sized enterprises (MSMEs) rose substantially. In 2019, global online alternative finance for business accounted for $35 billion, up 13% year-on-year and in 2020, increased significantly further by 51% year-on-year to $53 billion. By way of comparison, in 2019, business funding was 38% of the total volume, while in 2020 business funding accounted for 47% of the total volume.
As with previous years, online alternative finance for businesses overwhelmingly stemmed from debt-based models, with $32.8 billion of debt finance raised in 2019 (or 94% of all business funding) and $49.6 billion raised in 2020 (94%). Equity-based models contributed $1.5 billion in 2019 and $2.2 billion in 2020 (3% in 2019 and 4% in 2020). Non-investment models accounted for $533 million in 2019 and $744 million in 2020.
The highest MSME finance volumes were recorded in the US ($15.4 billion in 2019; $32 billion in 2020), the UK ($6.5 billion in 2019; $6.4 billion in 2020) and Europe ($4.3 billion in 2019; $5.2 billion in 2020). LAC alternative finance firms raised $4 billion for businesses in 2019 and $4.5 billion in 2020. In 2020 alone, just over 85% of all alternative finance volumes in LAC can be attributed to MSME financing. The Asia-Pacific region (excluding China) raised $4.3 billion for businesses in 2019 and $4.21 billion in 2020, reporting a decrease in volume for the first time after five years of continuous growth.
Institutional funding plays an important role in the functioning of the online alternative finance market, and increasingly so within the context of COVID-19. Based on data provided by 58% of the firm-level observations, we found that in 2019, approximately $28.5 billion of the market volume was financed by institutional investors, accounting for 16% of the entire global volume for that year. In 2020, based on 60% of the firm-level observations, approximately $43.6 billion of the market volume was financed by institutional investors, which represented 42% of the entire global volume. This represents a 53% year-on-year growth in the volume of institutional funding.
Overall, debt-based models make up the highest proportion of institutional funding, with most debt-based models having more than two thirds of their total finance provided by institutional investors. P2P/marketplace and balance sheet business lending firms reported the highest growth in terms of institutional funding volumes, and accounted for $13 billion and $21.2 billion in 2020, respectively. Geographically speaking, platforms in the US & Canada reported the highest level of institutionalised funding both in 2019 (74%) and 2020 (98%). In regions such as APAC and LAC, companies reported a yearly decrease in institutional investment. APAC firms reported a slight decrease from 61% ($3.47 billion) in 2019 to 55% ($2.93 billion) in 2020, whilst LAC reported a decrease from $3.16 billion in 2019 to that of $2.93 billion in 2020.
When considering the banking status of borrowers, on balance, alternative finance activities remain heavily skewed towards catering for those individuals and customers which are already banked. Crowd-led microfinance, unsurprisingly, is the only exception with 72% of clients categorised as unbanked, and 27% as underbanked.
The P2P/marketplace and balance sheet consumer lending models both saw slightly elevated instances of underbanked clients (25% and 20%, respectively). Lending models that focus on serving business clients have a slightly higher proportion of underbanked clients, though again the predominant client base is that of banked customers. 30% of clients in the P2P/marketplace business lending were categorised as underbanked, 27% for balance sheet business lending and 27% from invoice trading.
Geographically, online alternative finance firms in the UK primarily cater to banked customers (96%), with only 4% being identified as underbanked. Other regions with significantly high levels of banked customers were MENA (83%) and LAC (82%). In contrast, Fintech activities in SSA are showing their potential to improve access to finance for underserved groups, with respondents across the region indicating that approximately 49% of their customer base could be described as unbanked, and a further 48% as underbanked. Though still predominantly catering to banked customers, firms across the Asia Pacific reported that 51% of their clients were underbanked, with a further 4% unbanked.
Surveyed firms have provided information on the gender distribution of both their funders and their fundraisers. Overall, the percentage of female fundraisers has only slightly increased from 37.8% in 2019 to 38.9% in 2020. However, the percentage of female fundraisers of alternative finance activities in four of seven regions increased from 2019 to 2020: APAC (23% to 24%), Europe (26% to 34%), SSA (47% to 54%), and the UK (47% to 59%). However, activities in the US and Canada (55% to 37%), LAC (43% to 22%) and MENA (34% to 30%) all denoted a decline in the percentage of female fundraisers who utilised online alternative finance.
Female market participation differs widely across alternative finance models as well. For most models, female participation, whether as a fundraiser or funder continued to be below 40% and saw further declines during 2020. When reviewing debt and equity-based models, eight of eleven models reported catering to a lower percentage of female fundraisers in 2020, with P2P consumer lending reporting the largest drop in the share of female fundraisers from 61% in 2019 to 35% in 2020. However, donation-based crowdfunding had the highest number of female fundraisers at 63% across the models surveyed.
When considering key risks to firm operations, for a majority of respondents, a change in regulation is perceived as the greatest potential risk to firms. These concerns were especially prominent in firms offering services relating to P2P consumer lending (50%), balance sheet consumer lending (52%), and invoice trading (50%), where at least half of the respondents perceived this to be high risk. In addition, customer fraud is ranked as a major concern for firms in invoice trading (58%), p2p property lending (42%), and balance sheet consumer lending (41%).


